
First I’d like to apologize for my abscence these past few months. I’ve been very busy with work and I had trading related reasons for not wanting to post my trades, as it came to my attention that someone in the business was targeting my positions. Let’s just say they don’t really like it when people try to help people trade well, and there’s a reason why those that can do so charge money for their service.
Note to the market makers: Let’s also say that I’ve recognized what you can do, and I’ve recognized how to combat it, and if you want to try to target me rather than just piggybacking my trades like you should if you had a brain in your head, bring it on. I will always be a step ahead of you. You have no chance. I’m smarter than you, for sure, and the rules are now in my favor with next to no commissions. There, I said it. Bring it on if you want, I’m not going anywhere. You’d be better off just ignoring me. And you’d be way better off following my trades and positioning yourself to profit off them. You. Can’t. Beat. Me.
Anyways, we’ve gone on fairly well since I left. I’m sitting at just under 22K off the original $5000 that I began with about a year and a half ago. So things are solid.
Recently (earlier this morning) I came up with the idea of joining a friend in ownership of a rolling portfolio of options. The goal was to contribute less than $1500 and build a reasonably diversified portfolio using only options spreads that would minimize risk of loss while having a high potential upside. I just went through a few stocks on my watchlist and selected 7 of them (AMD, BAC, CLF, CRWD, DKNG, F and SPY) basically at random, other than trying to be somewhat diversified and including a market hedge. You can tell how random it was by the fact that I only made it to the Fs in the alphabetical listings.
I then studied the chart and came up with 6 trades that I give a high chance of success within those parameters (and one hedge, which hopefully would not be successful). This is just an example, but I think it will prove to be a successful example. We will follow these trades to fruition as if they had been made, including rolling them up or adjusting them as they go. Some of them will certainly find their way into my portfolio, and some of them already are but in different forms. I am simply trying to illustrate that it is not difficult to do something like this and do it well. Let’s go through it.
Advanced Micro Devices (AMD)
AMD has been clowning around for about 8 months now, but looks like it should be making a move back towards its previous all time highs. Here’s the weekly chart.
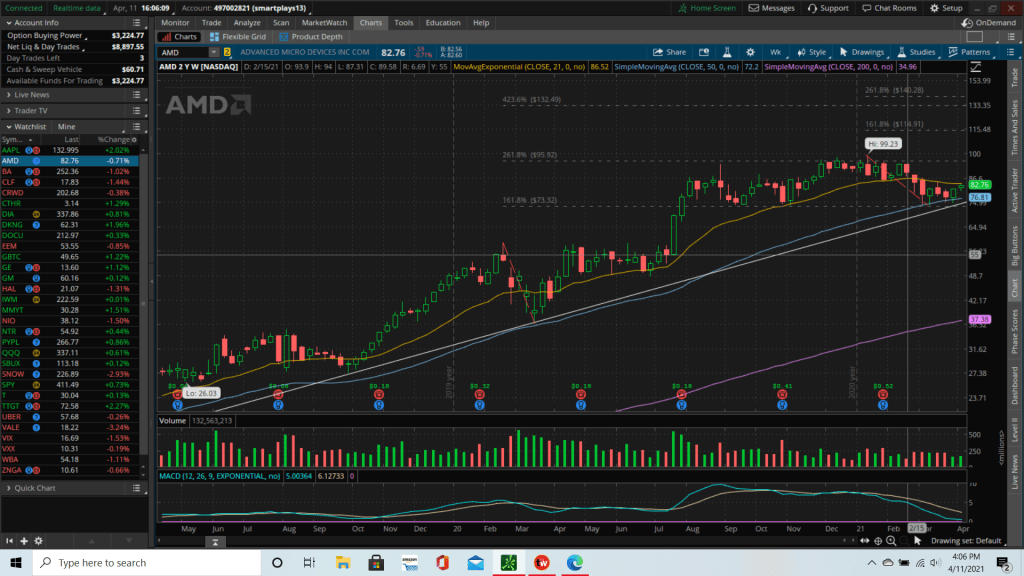
The expectation here would be that it begins to make moves toward the fibonacci extension it couldn’t get past, up around $96. We have a potential catalyst higher with their earnings report on April 27th that could easily catapult it past that mark and resume the uptrend. The simple play here makes the most sense, and for our portfolio that would be buying the May 90 call for $191 and selling the May 100 call for $60, better known as a verticle spread, because you are buying and selling vertically (or within the same expiration date). Net outlay here would be $131 plus commission, and that would be the maximum loss. Here’s the profit chart.
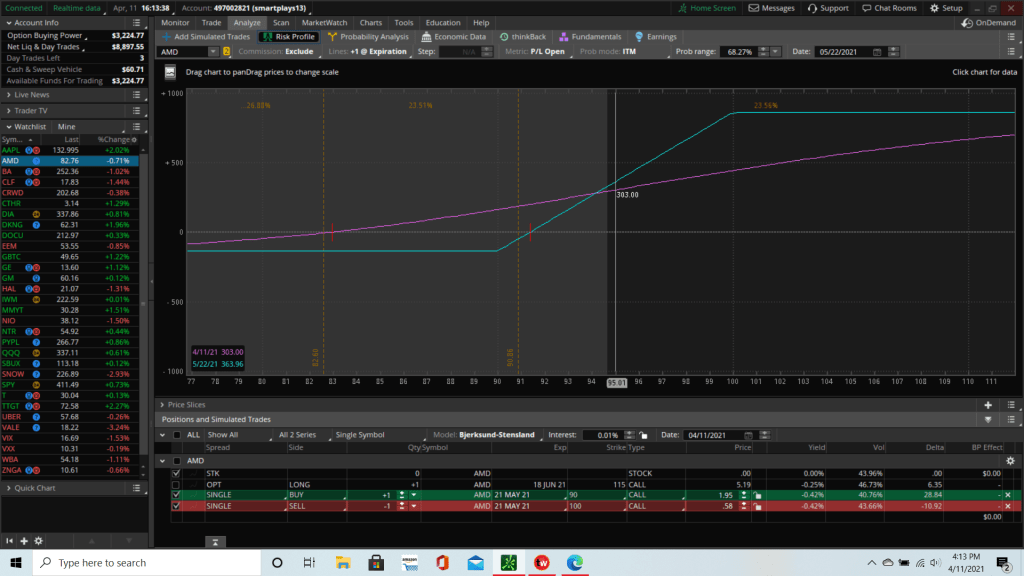
You can see that a simple move back up to $95 by May expiration would more than double the cost of the trade, and the max gain is $869. This was included to show that it is perfectly reasonable to make a short term upside bet as long as the potential loss fits into your plan. You could also just hold this until the day of the earnings release, and take your profit or loss before the risk event. Any price higher than where it is now will result in a gain on that date, and likely bigger than you’d expect because volatility (the premium people are willing to pay to buy or sell the options) tends to be at its highest leading up to that day, when the gamblers come out.
Bank of America (BAC)
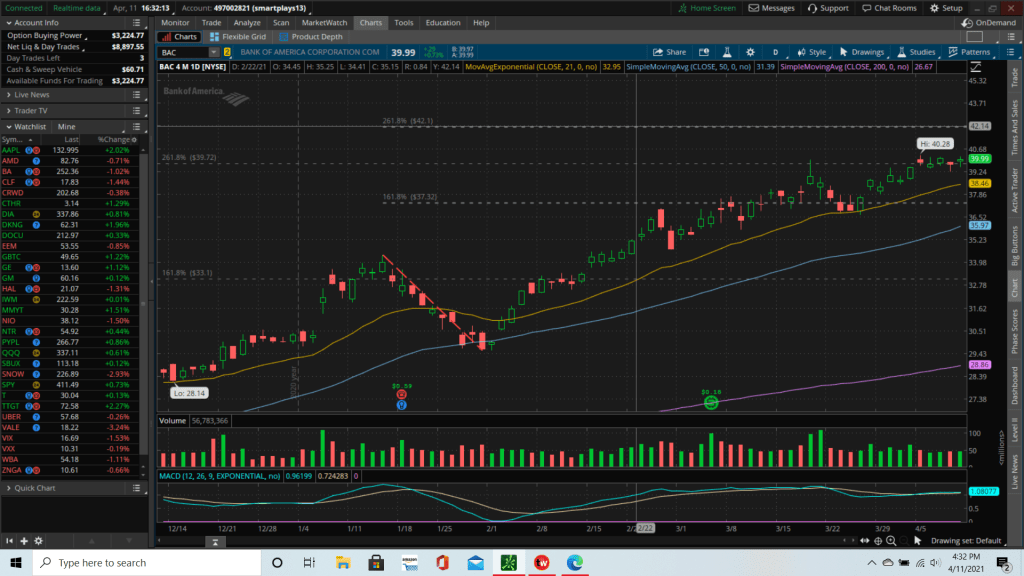
AMD showed one way to play an earnings report, but here’s one I like even better. BAC reports on April 15th before the market opens. We’re going to make a longer play on BAC’s continued strength by buying the August 42 strike call for $190, and we’re going to offset that cost by selling the May expiration 42 strike call against it for $78 credit. This is called a calendar spread, because you are spreading your options across the calendar, not at different prices. I chose August to buy because that will be after the NEXT BAC earnings report in July, and that call will retain a lot of its value as we head into THAT report, as long as the price action is good. I chose $42 because that appears to be a reasonable next target on the way up for BAC, given this chart.
Our net cost here is $112 (plus commission) but it is almost inconceivable that one could lose anywhere near that much if they handle it even remotely not-horribly.

This is the profit graph for this one. The magenta line is how your profit or loss would look depending on BAC’s price the next day. In all of these charts, as the current day gets closer in time to the expiration of your short option, your magenta line will start to conform closer and closer to the blue line. The blue line is an approximation of what you could expect to gain or lose on the day of expiry in May of the call we sold. BAC could fall to $37 and we’d only be down about $40. One of the cool things about this trade is that once the earnings report happens, all the extra cost that’s packed into the May call we sold will start to fall away, while the August call we have will retain most of its premium. If the price of BAC falls, we’ll be able to buy back the call we sold for next to nothing and re-evaluate from there. If it rises, we’ll let it play out til May or roll it up higher, depending on what makes the most sense.
The best thing about this trade is that when this profit graph expires, we still have an August 42 call. We can sell premium against it every week, if we want, or every month, or when it makes most sense based on our reading of the chart. This one trade could easily beome 6-10 little trades all with similar expectations to the chart above, before we’re done with it. If you handle this trade well, it should be very hard to lose more than $50 and the succession of trades flowing from it could make you many hundreds.
If you look at the bottom of my BAC profit graph, you’ll see a trade that’s unchecked that I played with a couple months ago. I didn’t make that particular trade, which is why it’s still there, but I made a similar one that made me a few hundred. You can see that it would cost $973 to buy today, but when I was playing around with it, it would have cost about $125. This has similar potential when you factor in all the ensuing trades that come with it.
Cleveland Cliff’s (CLF)
You don’t know what you’re missing if you don’t click through to YouTube to watch that video. (AFTER you’re done reading this and then come back!)
Onto my good friend, Cleveland Cliff’s. Mr. Claven has made me some good money this past year, and it makes a good option play as it continues it’s rise from the ashes to somewhere in the $25-27 range minimum. Cliffy took a bit of a pullback back to it’s gap point last week, and the good news is already out on its earnings based on the pre-announcement that caused the gap up to begin with. Now it’s like it never happened. (Hint: but it did.)
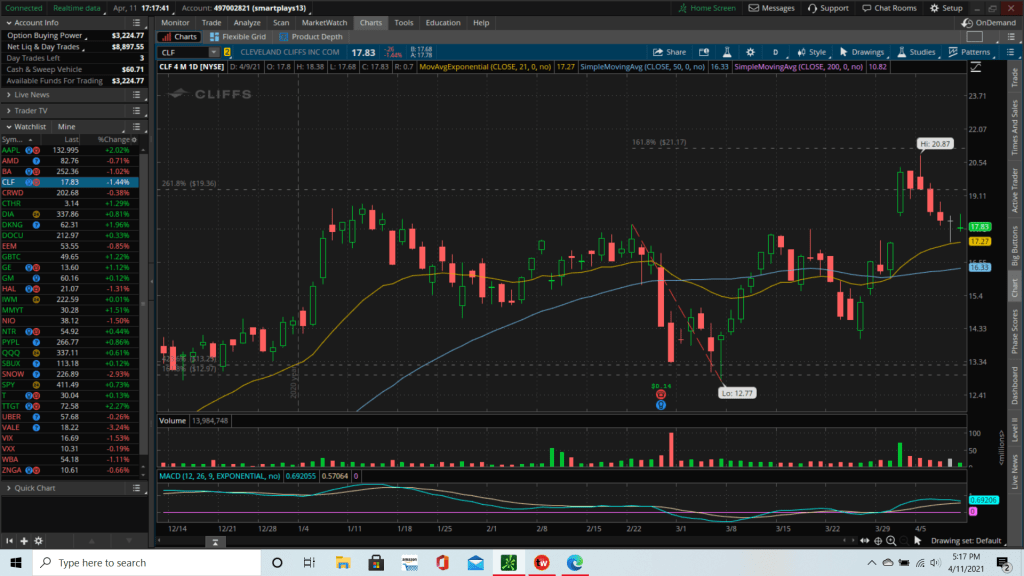
Cliff’s is known for huge price fluctuations, so we’re going to sell a longer term call to smooth out the price movements. For this one, we’re going to buy an October 23 strike call for $207 and sell a July 25 strike call against it for an $86 credit. Our max risk is $121, and we’re willing to lose it all, although for the same reasons as the last one, it would be hard to do. But CLFs can drop 40% like it’s nothing, for no reason, any time and recover just as easily. In fact, it just did in March. The trade I made is designed to allow you to survive those falls. This is called a diagonal spread, because you are spreading your buy and sell across different expirations and diagonally across different strikes.
Here’s the profit and loss chart at expiration of the July calls we sold. This is what a diagonal spread should look like. In my opinion, well-designed out of the money diagonal spreads are the best use of money one could make. If you get a big pullback for no reason, buy back that short call once it shows signs of recovery, wait a week or two, and sell something else against your long after it rallies, to resume the diagonal.

The July calls we sold will expire before the next earnings report, and we will be left with 3 months on our long call and all sorts of options on what to do with them.
Crowdstrike (CRWD) Who says you can’t make smart trades on $200 high-flying growth stocks with a small account? Not me. Crowdstrike is the next name I chose, to get some exposure to the high-growth section at a discounted rate (at least from whence it came).

Crowdstrike has had a nice pullback from its all time highs and just this week it crossed its recent downtrend line. It looks poised for a comeback heading into earnings, and we have a price target of right around $270. I’m going to buy the July 250 call for $550 and sell the June 250 for $400, resulting in a max loss of $150. CRWD doesn’t report until June 15th, and assuming this trades even ok, it will retain most of its value until then. When this gets back to the $250 range, we’ll look to lock in some profits and roll it up and out if it looks good. Here’s the P+L. If held through June expiry of our short option, you could make up to $1000 and still have a month left on your call. Tripling your money would be a reasonable result based on our expectations.

Draftkings (DKNG) I chose The King to illustrate a credit spread, because this stock frustrates me like nothing can, except bad drivers. But it’s going higher. They can try to shake you out all they want, but we all know it’s going higher. The cool thing about Draftkings is that its options are really overpriced. Why is that cool? Because you can pay yourself to sit and wait, selling one expensive option and buying a cheaper one.
This is not a chart of a stock that’s going lower for any significant period of time in a growing economy where governments are literally giving people money and saying, “Hey, you should open up a Draftkings account and bet on sports!”
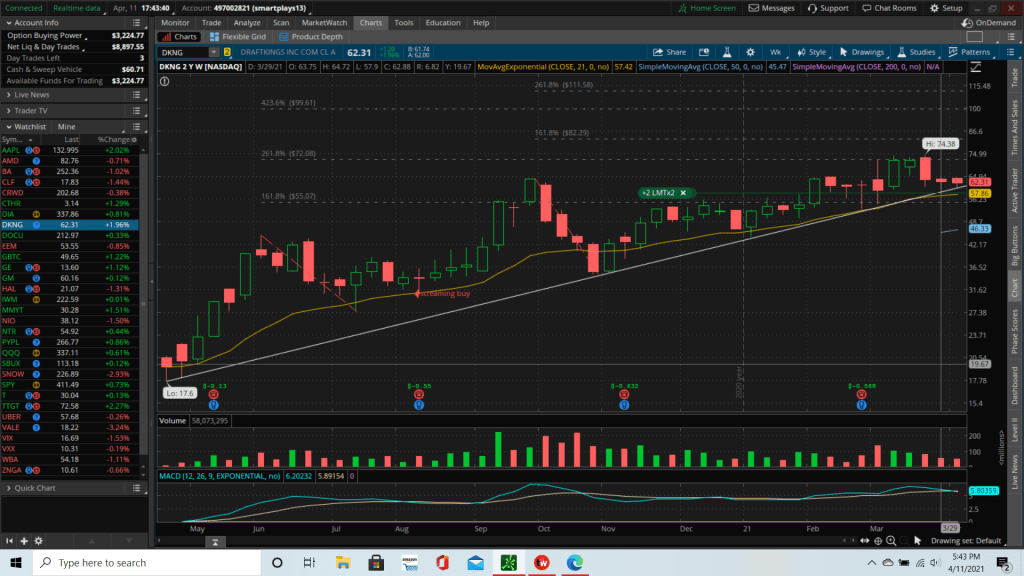
So we’re going to sit through a couple earnings reports and let the truth come out and get paid for waiting. Let’s sell the January 55 strike PUT for $875 and we’re going to buy the January 50 strike PUT for $650. They will pay you a total of $225 which will be immediately credited to your account, although it will count $275 against your margin balance. The goal is to keep your money and not have to buy it back for more than the $225 you received. If DKNG finishes January expiry above the 55 strike put we sold, we will have been paid $225 on $275 invested. That’s an 82% return in 9 months as long as DKNG doesn’t expire more than 12% down from where it is now after a 20+% pullback it’s already had. Here’s the P+L graph.
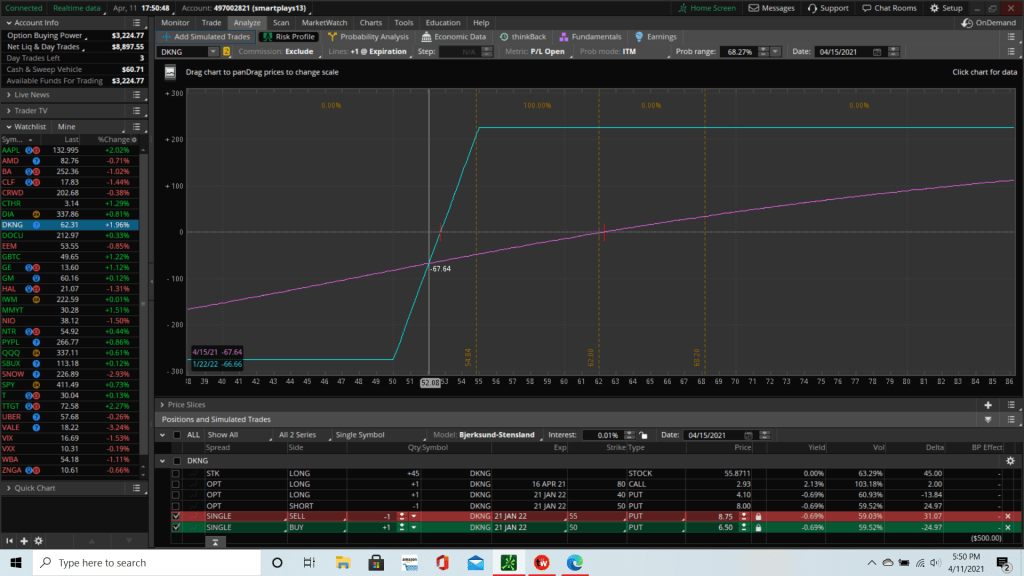
If you aren’t willing to risk the $275 potential loss, you can sell if it reaches below where I put my pointer, which is around $52. In that case, you’d lose about $70 and call it a trade. And in that case your risk of $70 vs a reward of $225 looks extremely inviting, especially given that it has to fall 20% to hit your loss and it can even go down 10% and you get all the reward. You could also sell when it reaches a set target amount of gain. If you decide ahead of time that making 25% on your money in two months is worth it, and it happens, then by all means, take it and do something else with the money.
Personally, I’m in a trade like this already and I buy a share every time this stock drops a dollar from the previous day’s high. And I keep buying if it keeps dropping. Anytime it feels toppy I sell some. I give it a couple dollars and then put my limit buys in lower again. It’s worked out. It’s my biggest position by far and will remain that way for the foreseeable future.
Ford (F) I’m in GM already, so I decided to add a different auto for this exercise and went with F. Because it’s cheap and I liked the chart.

We’re going to do a fun play on the potential of Ford breaking through its first price barrier of $13 and heading on up towards the next at $18.60-something. Recognizing that Ford is extended a bit, we’re going to protect the downside hard, as well. This is an expert level trade, combining verticality and diagonality, and frankly, it’s brilliant for what we’re trying to accomplish. The goal is to set us up for a potential big run in the stock while taking very little risk if it fails or stagnates early on.
We are going to buy 3 of the January 15 strike calls for a total cost of $345, and sell a May 14th expiry 11.50 strike call, bringing in $128. We’re also going to sell a January 20 strike call for $41. That’s a net outlay of $176 plus commission. Here’s the result.

Remember, the blue line is the expected profit or loss at expiration of the May 14th call we are short. So as you can see above, Ford could trade down all the way from $12.51 where it is now, to $11.50 on May 14th, and we’d actually have a small profit. Obviously, there are gains to be had to the upside. Ideally we’d want to see this run to the 13-15 range by then and we would be left with 3 long January 15 calls and 1 short January 20 strike call. We’d then have a bullish position that we’d be able to again sell one or even two monthly or weekly calls against to bring in extra premium. Rinse and repeat for the next 8 months or as long as it’s working, and you have an almost zero-risk trade for potentially large reward. If this dropped to say that $11.50 at expiration, you could basically repeat the trade with different strikes and have a do-over.
The biggest realistic risk to this trade is that it moves up too fast and you don’t sell your short May 14th call soon enough, and you make a lot less than you would’ve by being more bullish. I’m ok with risks that result in me making less money than I could’ve if I just decided to avoid being smart by protecting myself. If I only make $100 instead of $500 but I’ve made an essentially no-lose trade, that’s not a problem. And the downside risk is definitely there with this stock and the chip shortage, so I’d happily accept that tradeoff.
S&P 500 (SPY)
Finally, we’re going to put a little hedge on in case the market completely falls apart and our trades probably don’t work out very well. We hope to lose money on any hedge. When you buy life insurance, you aren’t pissed off when you get to the end of the year and haven’t died yet. But I’m going to set up the hedge so that it is definitely conceivable to profit off the hedge and still have our trades work out. This is because our trades have all been made with their own protections within them. They can all survive a 5-10% market correction in reasonably good shape. We’re going to hedge using the SPY, the ETF that mimics the S&P 500, because that is the most extended of the indices. Check out the weekly chart and you’ll see that all looks good as long as we hold above the $280 area. Below that we could have some issues. I want to protect us to that mark to some extent and am willing to put away $50 or less monthly to do so.
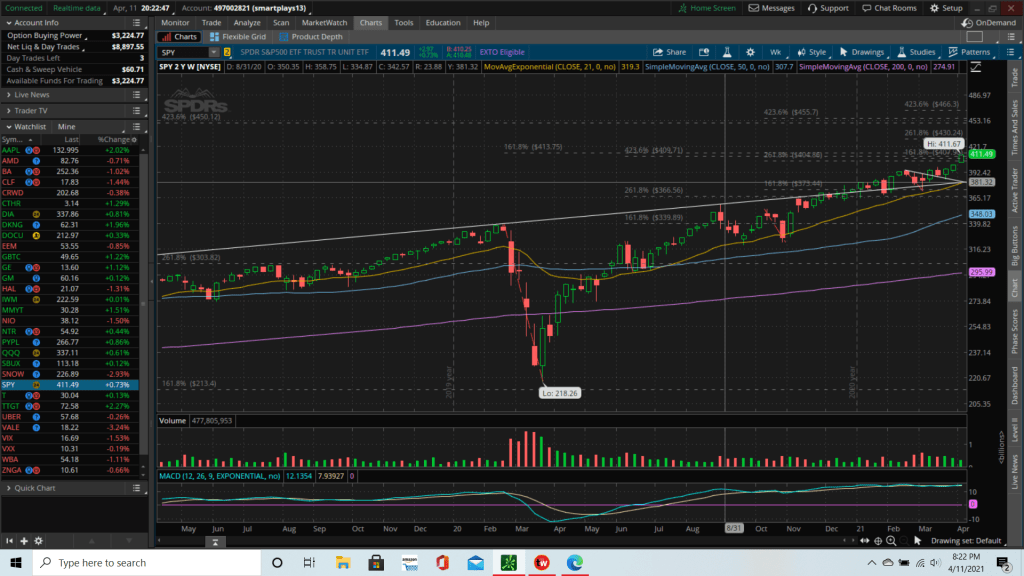
We are going to buy the April monthly $280 put and sell the same expiry $272 put for a net cost of $53 plus commission. In the event of a total disaster you have potential gains of $747. But the hedge will be evaluated constantly. If the market rises to the point where it’s only worth $25 or so, we’re going to take it off and start a new one. If the hedge is up say $100 a week before expiry, we’d take it off and find something that makes more sense going forward if we still want a hedge. The hedge will always be evaluated with the goal of not spending more than $50 a month and trying to take some profits if we have some and think it’s done correcting. We are not trying to be profitable by being bearish in the beginning of a bull market. At least it’s near the beginning in my view, and whose view would I trade besides my own? But I will protect myself to a reasonable extent. This does that.

So there you have it, a nice portfolio of diverse trades, all with built in protections and a hedge.
Here is the margin used in each trade:
AMD $131
BAC $112
CLF $121
CRWD $150
DKNG $275
F $176
SPY $53
Grand total of the portfolio: $1018 plus commissions
I will update the results and adjustments periodically.
Thanks for reading, happy trading and investing!
EDIT: Futures are down right now pretty good. Now futures are nonsense, which I’ve proven over and over, but if they stay around where they are by the time I wake up tomorrow and I can buy these cheaper than what I said here, I’m buying and we can all follow it for real.
EDIT II: There’s a decent chance I’m semi-intoxicated right now. There is a certainty that I can’t react at all times to big fluctuations while I’m working during the trading day. There is still no chance you can beat me, Market Maker, and you should know it by now. Goodnight.
